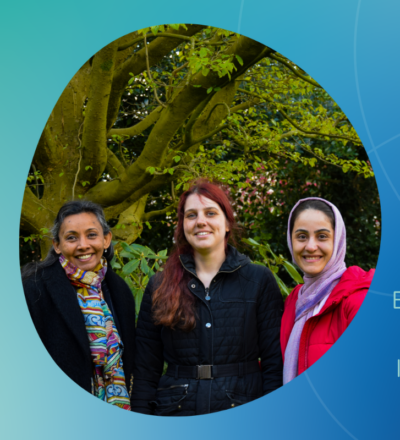
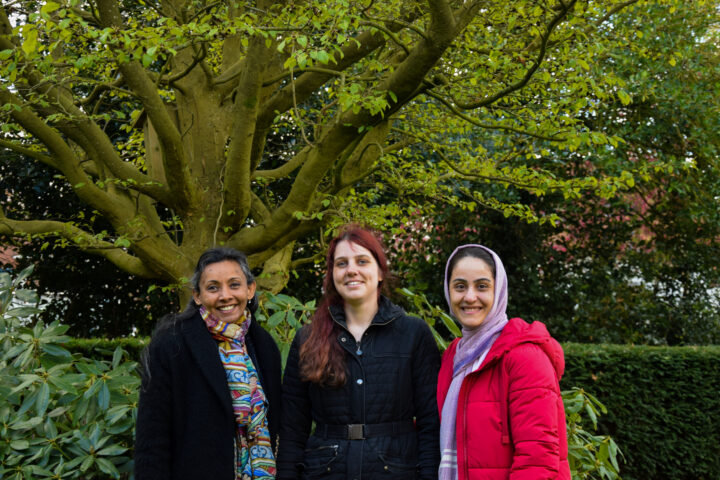
How can chemometrics contribute to a more sustainable industry? And how to derive meaningful and accessible information from data? We interviewed three women involved in the Engineering Business Intelligence (EBI) project. They work closely together to achieve the same goal: creating meaningful change for the industry.
“Whether it’s identifying anomalies like pollution events or optimizing processes for efficiency, the main goal is to derive value and wisdom from data,” explains Neha Awasthi, research coordinator of the project. In this project Neha and her team analyse process data from various industrial sources. The aim is to model natural variations and detect anomalies or faults in the system. This year, the team of the EBI project expanded with two researchers at Radboud University, each with their own expertise. In this interview we discussed their involvement in the project, the goals of the project and how it benefits the process industry.
Data-driven insights and decision-making
The Engineering Business Intelligence project started in January 2022, and has a running time for four years. In these four years they collaborate with multiple industrial partners within a consortium, consisting of 18 organizations. For instance, they work with data related to pollution in the Rhine River and process data from a sugar factory, Royal Cosun. “For all the partners involved we aim to provide clear insights and evidence. Our analysis can also inform decision-making and help case owners to take appropriate actions,” tells Mahsa Akbari, post-doc researcher at the Radboud University.
The main deliverable of the EBI project is the DOMA technology. This is a digital tool that predicts and reduces the environmental impact of process faults within economically profitable boundaries in the process industry.
The EBI workflow
You receive a big dataset: where to start? “The first step is understanding the question for each case,” explains Mahsa. “To align the use case questions with the EBI project workflow, we translate each use case’s question to fit that framework. Understanding the similarities between the use case questions and the objectives of the EBI project is crucial. The initial step is grasping the question. After that we can start preprocessing the data. Our aim is to meet regularly, in order to guarantee a continuous flow of questions, insights and data.”
Chemometric methods
“Extracting useful information from the large datasets can be challenging, but chemometrics provides the method to tackle this task,” states Mahsa. She became interested in chemometrics because of her fascination with coding, statistics, and chemistry. “Chemometrics combines these disciplines, and I found it particularly interesting because of the abundance of chemical data generated by powerful machines in various processes,” she explains. “With chemometrics, which are in fact mathematical models, we can model the natural variation in these processes by analysing the different measurements obtained. Such as temperature, pressure, and flow rates. By understanding the normal operating conditions, we can detect anomalies or faults in the system.”
Improving water quality through data
A notable example of the EBI project is the case in collaboration with RIWA-Rijn. In this case, researcher Berber Postma is diving into water data from the Rhine River. The focus is on providing evidence-based insights to address water quality issues. “We look for trends to identify sources of pollution. The aim of RIWA-Rijn, together with the International Commission for Protection of the Rhine, is to reduce the quantities of certain pollutants in the Rhine by 30% in 2040.”
Berber: “In this case we have observed incidents with elevated concentrations of certain compounds. By analysing the data, we can identify the source and development of these incidents, assess their impact and the level of harm. For instance, there was an incident in a factory in Leverkusen where compounds were released. We were able to detect the elevated levels of those compounds in the data collected at a location further downstream from the site.”
“Yet, we are continuously working on new and better methods to identify the source of pollution from the data,” says Berber. “It’s important to note that RIWA’s work is highly complex due to factors like weather conditions, rainfall, and the diverse locations of monitoring stations. Although our models take these complexities into account, accurately representing such dynamic systems remains challenging,” adds Neha.
Considering exponential models
In terms of modelling, Berber approaches the problem with an exponential model. “Current models assume a linear trend, but there is strong evidence that decrease in pollutants follows an exponential function. By modelling the data in a more sophisticated way, we can anticipate trends and identify potential deviations from expected progress,” explains Berber. Such insights prove valuable for RIWA-Rijn in effectively addressing these concerns with the relevant companies and stakeholders.
Developing a digital dashboard
All the different cases that the EBI project entails may have their own specific conclusions and recommendations, but there is an overarching objective. “We want to develop a digital platform or toolbox that can assist operations in optimizing processes, addressing anomalies, and achieve positive environmental outcomes,” tells Neha. To achieve this, the model or toolbox needs to analyse a substantial amount of historical data to learn the system’s behaviour. This process takes a lot of time. Once the model has learned from the data, it can predict when faults might occur. For example detecting a temperature drop as a potential trigger for a fault.
Neha: “Currently, we are in an intensive phase of data analysis, and we begin to involve stakeholders, operators, and bargaining processes to ensure that the assistant’s technical knowledge becomes meaningful and applicable in the organization.” For the development of a digital dashboard, various technical partners within the consortium will also bring in their expertise.
From publication to impact
To conclude the interview we asked them why they like their work so much. “One aspect I find personally satisfying is how our research, which may seem fundamental, can be applied in practical ways for the benefit of society.” The ability to bridge the gap between academia and industry they all find very exciting. “It ensures that our work doesn’t remain confined to academic publications but instead has practical implementation and creates meaningful change.”
Acknowledgement
This project is co-funded by TKI-Energy with the supplementary grant 'TKI- Toeslag' for Topconsortia for Knowledge and Innovation (TKI’s) of the Ministry of Economic Affairs and Climate Policy.