Every year, EBN releases ‘Energy in Figures’. This year marks the 6th edition and therefore the infographic also provides insight into the possibilities for speeding up the reduction of CO2. Additionnally, the infographic presents the most important facts and figures about energy(systems) in the Netherlands in 2021.
In this article, we take you through the most important facts and figures presented by EBN related to the Dutch energy sector.
The current state of Dutch Energy Sector
The first part provides us an overview of the Dutch energy system, all in one glance. It looks at primary consumption, the energy sources that ‘feed’ the system, the final consumption and the energy carriers that provide directly available energy to the end-users.
From this figure we learn that natural gas and oil, to this day, remain the main sources of energy in the Netherlands. Part of the energy sources, such as wind energy, can be directly available for final consumption. While other parts of the energy, for example as natural gas, need to be converted first. Moreover, it seems like some parts of the the energy in the Netherlands are lost along the way. This can happen through the conversion itself, through the energy sector’s own use or during the distribution of the energy.
Our energy in figures
The second part discusses the current energy figures. These include production and consumption, but also imports and exports of energy. In these figures we also see the degree to which the Netherlands is self-sufficient in its energy resources.
An important fact to consider from this part of the infographic, is that the Netherlands is much reliant on the importation of gas. The net export of gas has decreased, mainly due to the shutdown of the gas tap in Groningen.
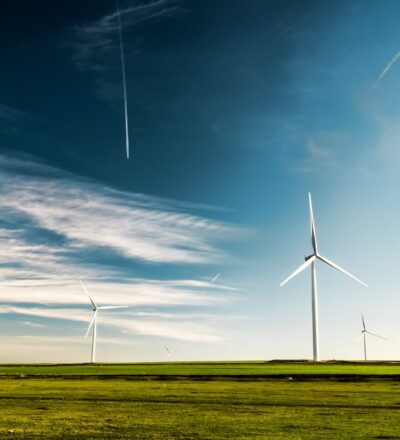
It also becomes clear that renewable sources still account for only a relatively small share of total primary consumption. Nevertheless, EBN notes that the share of renewable energy has doubled over the past five years. Mostly because of the growth of biomass and wind energy. Another key element to consider are greenhouse gases and the share of the various sectors involved in this. The last figure shows us the development of emission reduction in relation to the Dutch national targets.
The switch
All-in all, the facts and figures make it clear that there are still some big steps to be taken. Especially when it comes to reducing CO2 emissions the Netherlands has still a long way to go to reach the goals of 2030. Therefore, the third and final section on the back of the infographic, called ‘The knob to turn’, or in other words, it shows what buttons we can turn to accelerate CO2 reduction each year.
These opportunities are outlined at different levels. For example, it looks at the effect of replacing the natural gas consumption of one million households in the Netherlands with green gas. And how much CO2 can be saved if millions of homeowners realize for better insulation of their homes or install solar panels.
When it comes to industries, one of the things that becomes evident is how much CO2 can be saved if industry’s decide to switch to renewable sources. We also see what the effect can be of using CO2 capture and storage. In the area of mobility, the infographic also provides insights at the gains to be made by leaving the car behind more often and taking the (electric) bike.
All facts and figures can be downloaded in Energy in Figures